General Description
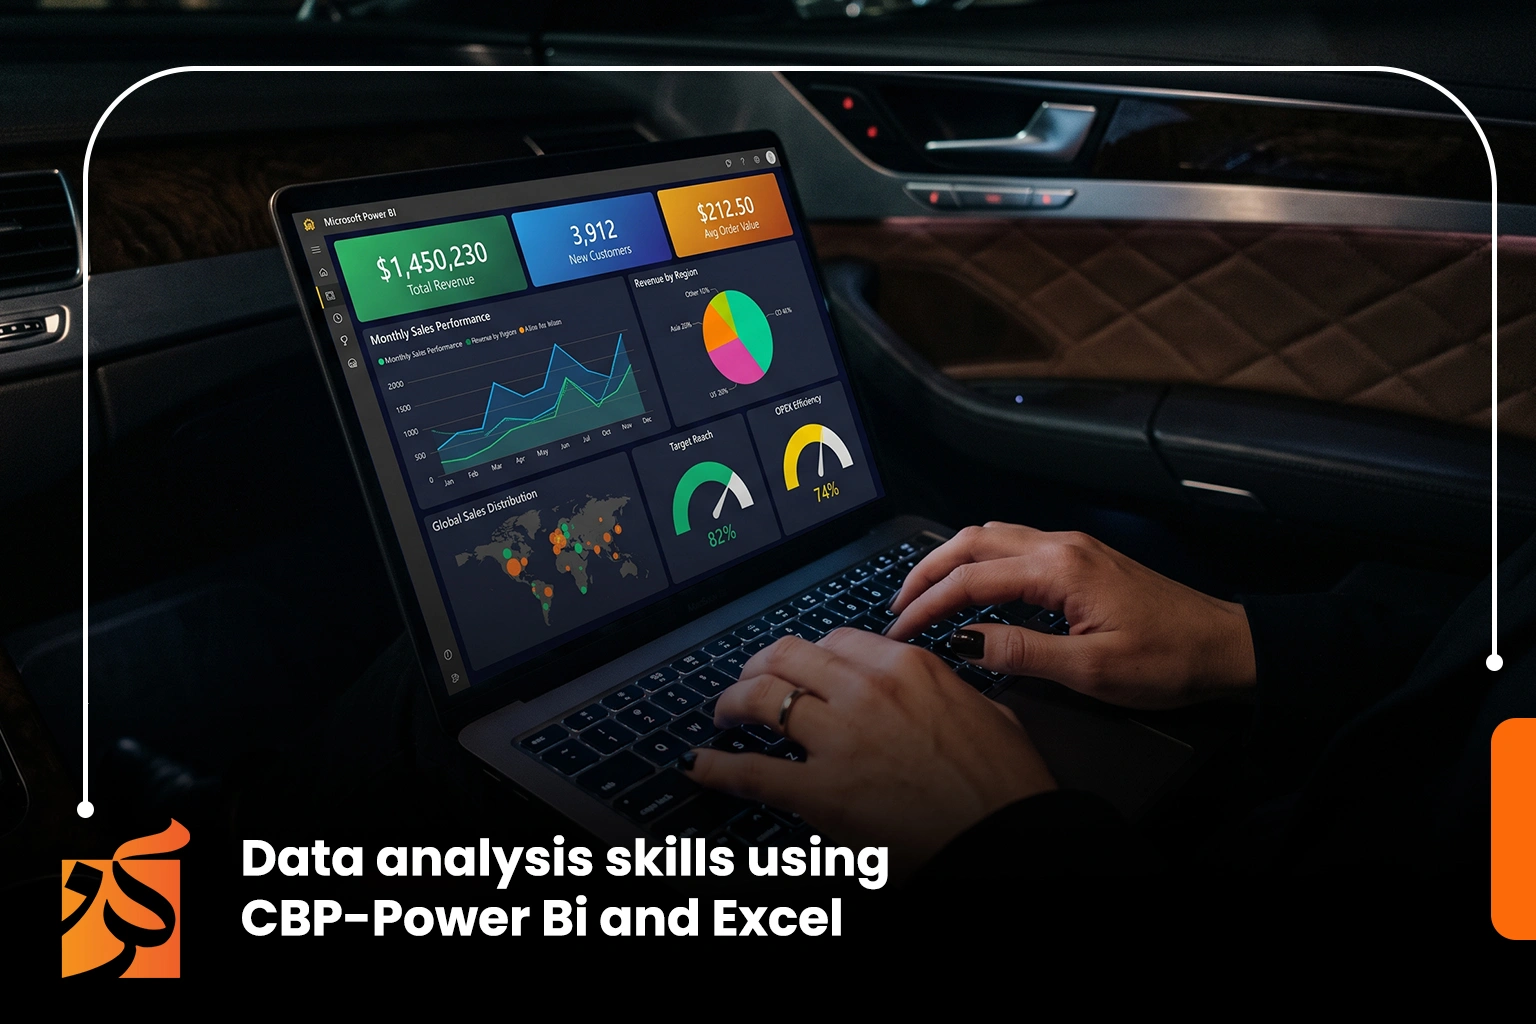
An accredited professional track by the TVTC, designed to empower you to transform complex data into interactive dashboards and smart decisions using Microsoft Power BI. Through the BeTraining platform, you will master all stages of data processing, from connection and cleaning to advanced DAX analysis and engaging visual report design. This program is a strategic investment to advance your career and meet the growing demand for data analysts in the Saudi labor market.
The Goals
By the end of the program, you will be able to:
-
Understand data analysis fundamentals and import data from various sources (Excel, SQL, Cloud).
-
Master data cleaning and transformation tools using Power Query.
-
Build data models and understand relationships between tables.
-
Acquire advanced formula writing skills using the DAX language.
-
Design interactive reports and smart dashboards that facilitate performance analysis.
Target Auidence
The program is designed for those currently working or aspiring to work in:
-
Data Analysts and Business Analysts across all sectors.
-
Department Managers and those responsible for preparing periodic reports.
-
IT Specialists and Systems Management professionals.
-
Accountants and those interested in Artificial Intelligence (AI) and Business Intelligence (BI).
The Features
Completing this training track provides numerous professional and competitive advantages, most notably:
-
Fast Decision-Making: The ability to provide senior management with immediate and accurate data.
-
Technical Excellence: Mastering the world's most powerful data analysis tools.
-
Career Development: Increasing employment opportunities in Business Intelligence (BI) roles.
-
Productive Efficiency: Saving time and effort by transforming manual reporting into automated dashboards.
Topics
إليك الترجمة الاحترافية لهذه المحاور التدريبية:
Topic 1: Introduction to Business Intelligence and Power BI
-
Overview of the Power BI Desktop interface and the Cloud environment.
-
Methods for importing and connecting data from various sources.
Topic 2: Data Transformation and Processing (Power Query)
-
Cleaning and restructuring data to prepare it for analysis.
-
Handling errors and filtering out duplicate data.
Topic 3: Data Modeling and DAX Language
-
Establishing relationships between different datasets.
-
Writing advanced functions and Measures using the DAX language.
Topic 4: Visual Design and Interactive Reporting
-
Selecting the appropriate charts for each data type.
-
Adding filters and interactive features to reports.
Topic 5: Publishing Reports and Sharing
-
How to upload reports to the Power BI Service.
-
Managing permissions and securely sharing results with the team.
Learning outcomes
-
Analytical Proficiency: The ability to build a comprehensive data analysis system from scratch.
-
Visualization Excellence: Professionalism in designing visually engaging and easy-to-understand reports.
-
Keeping Pace with Digital Transformation: Mastery of modern tools that support intelligent organizations.
-
Career Advancement: Gaining a competitive edge as an expert in data visualization and analysis.
Requirements And Conditions
-
Commitment to attending training hours and engaging with practical projects.
-
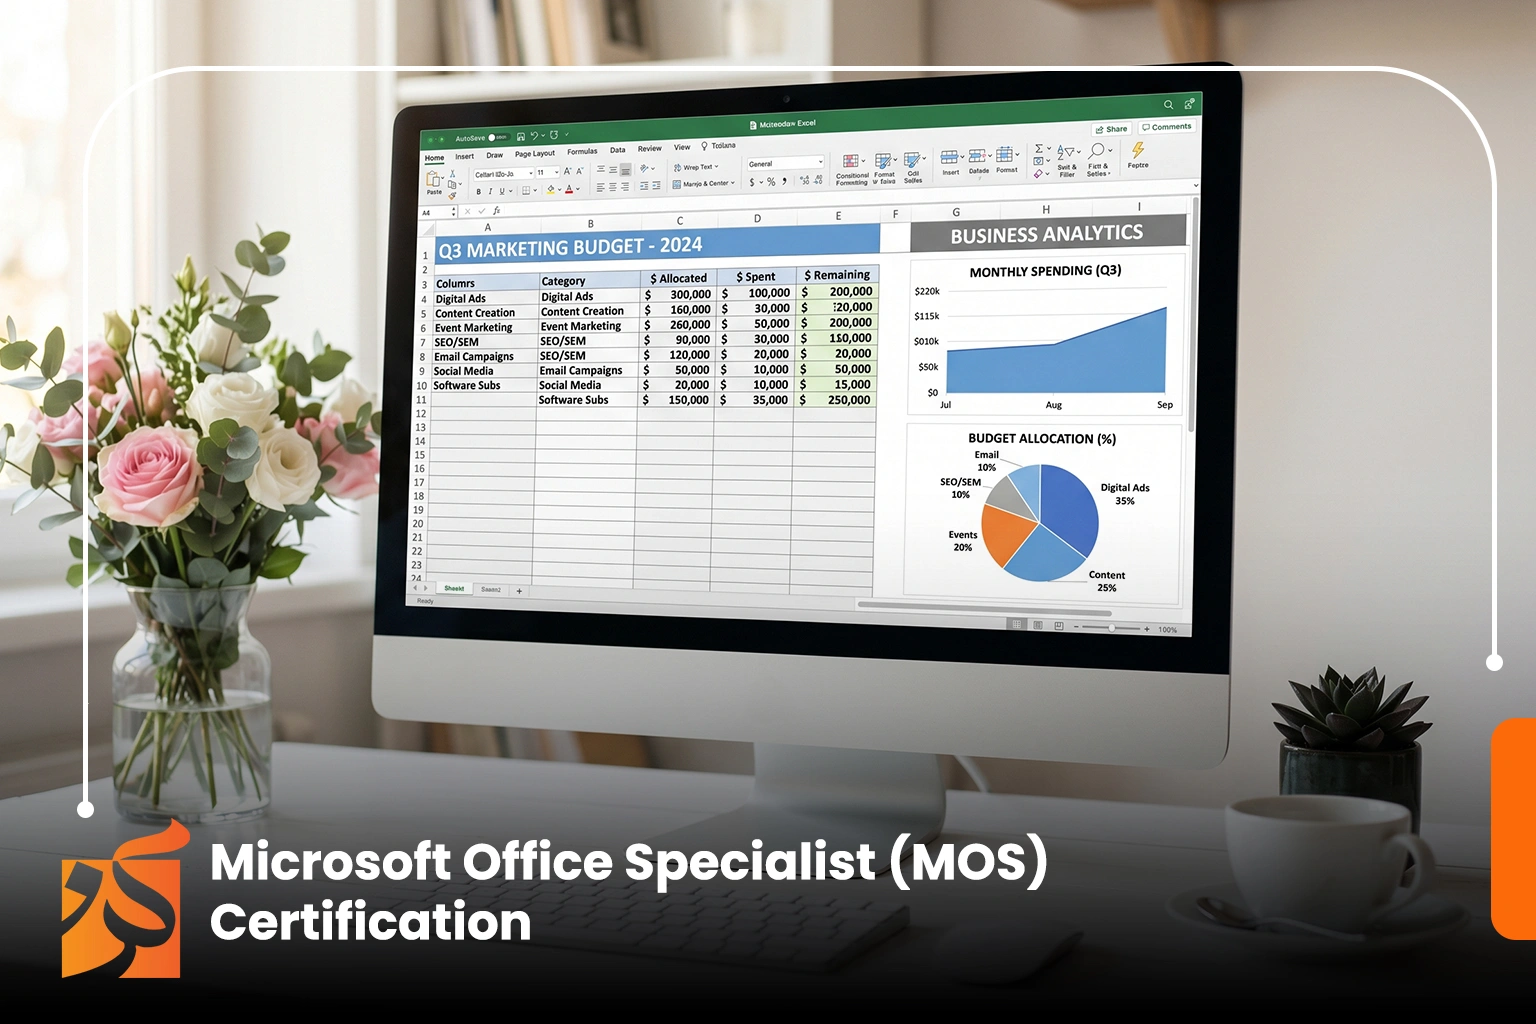
Basic proficiency in Microsoft Excel and spreadsheet management concepts.
-
Successfully passing the final assessment of the training track.
FAQs
The Blog
In light of the rapid shift towards "Business Digitalization" and the realization of Saudi Vision 2030, data analysis skills have become an indispensable necessity for every ambitious professional seeking excellence in the labor market. The Power BI Data Visualization Track, accredited by the Technical and Vocational Training Corporation (TVTC), serves as the golden gateway to mastering the transformation of raw data into strategic insights and smart decisions. Through leading platforms such as BeTraining, trainees can access intensive practical training that combines technical power with official accreditation, ensuring a tangible competitive edge in their various career paths.
What is the Power BI Data Visualization Track (TVTC)?
This training track, offered via professional platforms like BeTraining, is a specialized program designed to teach trainees how to use Microsoft Power BI effectively. What distinguishes this certificate is its official accreditation by the Technical and Vocational Training Corporation (TVTC), which provides significant formal weight in the Saudi labor market, within both the public and private sectors.
The program aims to transition trainees from manual data handling (such as complex Excel spreadsheets) to the stage of automation and Artificial Intelligence in data analysis and visual presentation through interactive dashboards.
Why Should You Get This Certificate?
Obtaining an accredited certificate in Power BI is not just an addition to your CV; it is a strategic investment for several reasons:
-
Increasing Market Demand: Major companies in Saudi Arabia are looking for "Data Analysts" capable of providing immediate solutions rather than just static reports.
-
Decision Support: The tool enables you to connect various data sources (Excel, SQL, Cloud) into a single screen, helping managers and decision-makers see the full picture in real-time.
-
Improving Productivity: Instead of spending hours manually updating reports, Power BI allows you to automate these processes, freeing up time for more critical tasks.
Core Training Pillars
The training course associated with this certificate covers the entire data journey, typically including:
A. Data Import and Cleaning (Power Query) The track begins by teaching you how to fetch data from diverse sources and then how to "clean" it. Raw data is often unorganized or contains errors; here, you learn Data Transformation skills to make it ready for analysis.
B. Data Modeling This is the "engine" behind Power BI. You will learn how to build relationships between different tables to ensure reports work harmoniously and provide accurate results when filtering or segmenting data.
C. DAX (Data Analysis Expressions) DAX is the secret behind the power of Power BI. You will learn how to write advanced formulas to extract Key Performance Indicators (KPIs), such as calculating annual sales growth or comparing performance across different time periods.
D. Data Visualization and Storytelling The most exciting part, where you learn to choose the appropriate chart (maps, graphs, gauges) and format them professionally to capture attention and deliver information as quickly as possible.
Target Audience
This track is not restricted to tech specialists; it extends to:
-
Accountants and Finance Professionals: For analyzing budgets and cash flows.
-
Project Managers: For tracking progress rates and risks.
-
HR Professionals: For monitoring employee performance and turnover rates.
-
Business and Tech Graduates: Seeking to enter the job market with a high-demand technical skill.
Advantages of Training via BeTraining
By joining this track through the BeTraining platform, you receive a comprehensive educational experience including:
-
Learning Flexibility: Access to content anytime and anywhere, suitable for both employees and students.
-
Practical Application: A focus on projects that simulate real-world work environments, not just theories.
-
Accredited Certificate: A certificate with an official accreditation number from the TVTC, appearing on the "Manar" platform, making it easy for employers to verify.